Main menu
You are here
Model entry
| Search | Simulistics | Model catalogue | Listed by keyword | Listed by ID | Listed by title | Listed by date added |
Model of plant dark respiration as an exponential function of temperature parameterised by Q10
Model : respirationQ10
Simile version : 3.1+
Date added : 2003-09-05
Keywords :
Ecophysiology ;
Carbon dynamics ;
Description
Respiration here means the production of carbon dioxide as a by-product of the process by which energy in carbohydrate is released (in the form of ATP) in living things.
The basic ecophysiological respiration model is an exponential function of temperature
(which has a physical basis in the Arrhenius equation).
Respiration rate, R = Ro * exp(k*t)
where:
- R is the respiration rate
- Ro is the respiration rate at zero Celsius
- t is the temperature (Celsius)
- k is a empirical constant
Files
Model fileClick on the icon to download the model file. (You will need Simile to examine and run the model. A free evaluation version is available from the products page.) Some browsers may attempt to display the model file, rather than open it in Simile; in this case, use the browser back button to return to this page, and use the context menu (invoked by right-clicking on the link) to save the target file to disk. |
|
|
|
|
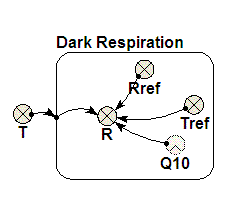
Diagram

Equations
 Respiration rate,	R = Rref*Q10^((T-Tref)/10)
	Where:
    	Rref is respiration rate at reference temperature Tref
 		Tref is the temperature where respiration rate equals Rref
		Q10  is the coefficient by which R increases for every 10 Celsius increase in temperature.
		T    is the respiring tissue temperature.

		Any consistent set of units may be used.
Results
|
The graph above shows respiration rate increasing with temperature for a Q10 of 2.0 and 2.5 (higher rates) Tref = 0 and Rref = 1.
|Copyright 2003-2024 Simulistics Ltd
