
Main menu
You are here
Model entry
| Search | Simulistics | Model catalogue | Listed by keyword | Listed by ID | Listed by title | Listed by date added |
Area covered in “flowers” compared with logistic growth model
Model : flowers2
Simile version : 3.1+
Date added : 2003-07-15
Keywords :
Area (modelling changes in) ;
Vegetation dynamics ;
Lumped model ;
Logistic growth ;
Description
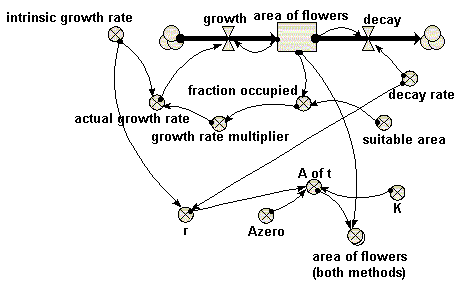
This models the spatial spread of vegetation over an area. Here, the vegetation is taken to be “flowers”. This is not a spatial model, in the usual sense where space is divided up into discrete units. Rather, the area covered by the flowers is represented by a single state variable, with an inflow representing increase in area (spread), and an outflow representing decrease in area (death of flowers).
This is actually two models in one: a dynamic model of the spatial spread of the flowers, and the analytical form of the logistic growth equation, to enable the two to be compared.
Note that this illustrates a useful tip for comparing two models: put them into the same Simile model, so that they will be running in parallel. You can then produce a single graph or table comparing the behaviour of matching variables from the two models. Enclosing each of the two models in its own submodel envelope would make the separateness of the two models visually clearer.
Files
Model fileClick on the icon to download the model file. (You will need Simile to examine and run the model. A free evaluation version is available from the products page.) Some browsers may attempt to display the model file, rather than open it in Simile; in this case, use the browser back button to return to this page, and use the context menu (invoked by right-clicking on the link) to save the target file to disk. |
|
|
|
|
Diagram
Equations
Compartments:
	area of flowers
	Initial value = 10
	Rate of change =  + growth + decay
	Comments: hectares (OK, Ford says acres, but we are in the 21st century now).

Flows:
	decay = area_of_flowers*decay_rate

	growth = area_of_flowers*actual_growth_rate

Variables:
	A of t = Azero*exp(r*time(1))/(1+Azero*(exp(r*time(1))-1)/K)

	actual growth rate = intrinsic_growth_rate*growth_rate_multiplier
	Comments: dimensionless

	area of flowers (both methods) = [area_of_flowers,A_of_t]

	fraction occupied = area_of_flowers/suitable_area

	growth rate multiplier = graph(fraction_occupied)

	intrinsic growth rate = 1
	Comments: I.e. 100% per year

Parameters:
	Azero = 10
	Comments: Initial area of flowers (hectare)

	decay rate = 0.2
	Comments: Proportion decaying (per year)

	K = 800
	Comments: "Maximum value that the flowered area would reach over time"

	r = intrinsic_growth_rate-decay_rate

	suitable area = 1000
	Comments: hectares (see 'area of flowers'...)
Results
|

References
Ford, A (1999) Modeling the Environment.
Island Press. p.62
Copyright 2003-2026 Simulistics Ltd