Main menu
You are here
Model entry
| Search | Simulistics | Model catalogue | Listed by keyword | Listed by ID | Listed by title | Listed by date added |
Multi-agent model for the quantitative study of Spatial Organization
Model : SpatialOrg
Simile version : 3.1+
Date added : 2004-01-05
Keywords :
Spatial organization ;
Spatial modelling ;
Multi-instance submodel ;
Multi-agent systems ;
Description
The model SpatOrg implements ideas about the information theoretic measure developed to quantify spatial organization (Krivov et al., 2003). The model illustrates the spatial organization by an example of flocking. To begin with, consider the correlations between the spatial events Ski,t,x,y(a) (where k corresponds to any of the spatial events: 'arrival at', 'stay put', 'departure from' and 'absence at' the site (x, y associated with the agent a of species i, in a two dimensional space, at time t) and the coupling of the set of all spatial events pertaining to the agents of species Ci that happened at site (x, y) at time t. The index of spatial organization is calculated as follows:

The value SCi(t, x, y)represents the correlation between the arrival, staying put, departure and absence at a site(x, y) of the agents of species Ci at time t. The intuitive interpretation of AMI (average mutual information) suggests that, if these events are correlated, then the behavior of species Ci is organized, and the value of SCi(t, x, y) will be high.
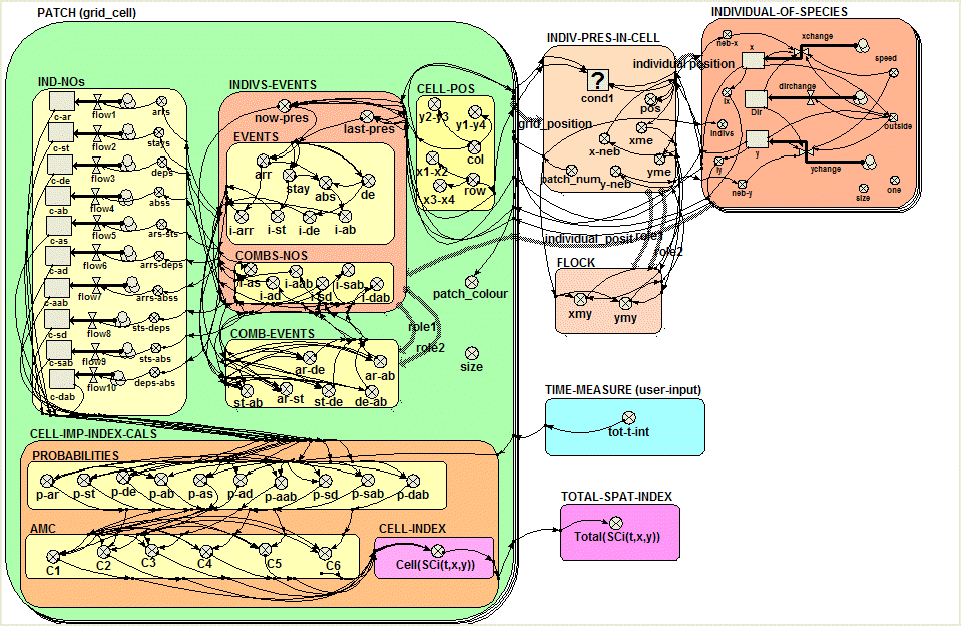
The model SpatialOrg is the first of a series of models to be developed as a demonstration of the quantifying measures. The main challenge of this model is to calculate the probabilities. The probabilities are estimated as the ratio of the number of times the event occurs to the total number of time intervals. The calculation of probabilities (submodel:patch (grid_cell)) included following steps:
- calculating the associated spatial event ('arrival', 'stay', 'departure' and 'absence') in a cell for every agent (submodel:events);
- calculating the correlation of the events in a cell (submodel: comb-nos) i.e. every agent per agent per cell;
- counting the numbers of events (submodel:ind-nos);
- calculating the probability of particular event and the combinations of events (submodel: probabilities);
- calculating Average Mutual Constraint (AMC) for every combination of events X and Y (submodel: AMC) as P(XY)*log(P(XY)/(P(X)*P(Y)));
- summing up the AMCs of all the events to obtain the spatial index in a cell.
- Finally summing up all the spatial indexes from all the cells and obtaining the total spatial index (submodel: total-spat-index).
The SpatOrg model space is a collection of cells arranged in a regular two-dimensional lattice of size 10x10=100 cells. The spatial index is calculated for every cell based on the correlations of spatial events performed by the individuals/agents. The number of individuals/agents is equal to 20. However, the model could be modified for a varying population as well.
Simulistics is indebted to Anju Dahiya (adahiya@uvm.edu) for permission to include this model in the catalogue. Please contact Anju Dahiya for more information about the model.
Files
Model fileClick on the icon to download the model file. (You will need Simile to examine and run the model. A free evaluation version is available from the products page.) Some browsers may attempt to display the model file, rather than open it in Simile; in this case, use the browser back button to return to this page, and use the context menu (invoked by right-clicking on the link) to save the target file to disk. |
|
|
|
|
Diagram

Equations
A separate list of the model equations is available.
Results
|The figure 1. shows spatial importance index of a species for 10,000 time steps at a regular interval of 100 time steps. The model run without the flock submodel and on removing the related links to the individual-of-species submodel brings down the spatial index significantly. Different hypothetical cases of ecological systems are considered to illustrate the spatial importance index. The results are in preparation for a publication.

Figure 1. Spatial importance index at 10000 time steps

Figure 2. Screenshot of animation window showing agents after few runs.
|Copyright 2003-2024 Simulistics Ltd
