Main menu
You are here
Simile at a glance
Visual modelsSimile is a visual modelling environment, allowing you to draw the elements of your model, and the relationships between them. Using simple mouse actions, you can re-arrange the elements, annotate the diagram or add graphics. The key to creating the model is to add influences between related variables. This provides the model with a clear and self-documenting structure. |
 |
 |
System Dynamics notationSystem Dynamics notation is an intuitive and insightful way to express concepts about rates of change. By analogy with water tanks and pipes, the compartment/flow notation allows complex differential equations to be formulated and solved without any special mathematical skills. |
Powerful equation languageOnce the chains of influence in the model have been drawn, you can express the mathematical form of the relationships using Simile’s powerful equation language. This provides a comprehensive range of mathematical expressions as well as built-in constructs for handling arrays. |
if TA < 0.7 then 1.570796 - atan(TA / sqrt(1.0 - TA^2)) else atan(sqrt(1 - TA^2) / TA) |
 |
Object-basedSimile is unique in providing a marriage of System Dynamics notation with object-based constructs. Crucially, this allows complex models to be expressed concisely and thus greatly extends the range of behaviours and systems that can be modelled. |
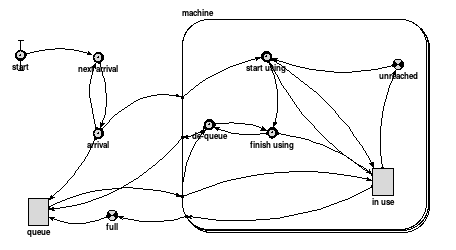
Discrete EventsSimile also allows discrete events to be included in models. These can be used on their own along with rule-based state variables to create fully discrete simulations, or they can be mixed with system-dynamics symbols, in which case events can be triggered by continuous values reaching limits, and can instantaneoulsly affect compartment levels. |
 |
 |
Run simulationsWorking with models is a two-step process: firstly, you describe your system using the graphical and mathematical tools provided; secondly, you simulate its behaviour over a period of time. Simile converts your description into fast efficient C++ code in order to simulate its behaviour. This C++ code is compiled into an executable model to run in the model run environment but may also be incorporated into other programs (Enterprise Edition licence). |
Display results as graphs, tables or animationsSimile provides a range of tools for visualising the behaviour of the system, using graphs, tables or animations. You can design additional display tools using the templates provided, if necessary, or export your results to another program for analysis. |
 |
Declarative modelsOne of the most exciting possibilities about modelling in Simile is that models are stored as a set of declarations about the model structure, much like a blueprint for its design. This opens the door to thinking of a wide variety of ways in which the computer can assist the modelling process, beyond merely simulating the behaviour of the system. |