You are here

How to

The aim of this section is to introduce you to a number of compartment-flow modelling building blocks that you can incorporate into your own modelling. Most of these relate to the inclusion of exogenous variables — externally-varying factors such as temperature or rainfall — in your model.

6. Conclusions

These five examples have demonstrated a number of important points.

5. Using a population submodel

The above examples all share one thing in common: they represent a population in terms of the values for one or more state variables, there being as many state variables as there are classes in the population. Each state variable may be engineered to have integer values (on the basis that populations contain a discrete number of individuals), or to have real (floating point) values, if you are content to think in terms of population density (i.e. number per unit area) rather than absolute numbers.

4. Age classes, using a multiple-instance submodel and an association model

The previous method is a big improvement: it is a much more concise way of representing multiple age classes, and exactly the same model can be used regardless of the number of classes we have: in other words, it scales up to larger problems. However, it suffers from a couple of disadvantages:

3. Age classes, with a multiple-instance submodel

The above two examples are expressed in conventional System Dynamics terms. They set the scene for the next three, which are now expressed in terms unique to Simile.

2. Age classes, with a separate compartment for each age class

The same population is now represented by four compartments, one for each of four age classes. The first one represents the first year group, the second represents the number of animals aged 1-5 inclusive, the next animals aged 6-15 inclusive, and the fourth for all remaining animals. As before, the mortality rate per animal is independent of population size, but now depends on its age (there is a different m value for each age class). The reproductive rate per individual is still influenced by total population size, as well as now being different for each age class.

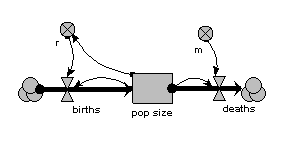
1. A lumped population

In this model, the population is represented by a single compartment, representing the total number of animals in the population or the population density (number per unit area). Reproduction is assumed to be density dependent (the reproductive rate per individual, r, declines as population size increases), whereas mortality is not (the mortality rate per individual, m, is independent of population size).

Lumped population model diagram

Population dynamics

The following sequence of five models illustrates two things. First, it shows that one problem — that of modelling changing population size — can be approached in a variety of ways, based on quite different methods for representing the population. Second, it introduces you to a range of constructs that Simile provides for modelling, including the “population submodel”, array variables, and the “association submodel”.

Drupal updated but FCKeditor nolonger available

Drupal has updated been updated to fix all security warnings and also some other recommended updates but the FCKeditor is no longer available.

Model Gallery: where next?

For a more in depth look at some models have a look at the worked examples and a wide range of models with varying quality of documentation can be found in the model catalogue.

Pages

Subscribe to Simulistics RSS