Step 5: Choosing the output displays
Step 5: Choosing the output displays
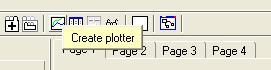
1. Select the graph-plot display
- Click on the
 "Plotter" display tool on the toolbar; or select it from the list in the Add menu.
2. Choose the variable you wish to have displayed
Note the graph window that appears. This is initially scaled with default values on both axes, but will rescale itself as needed. You can re-size the panel containing the graph by dragging on the little boxes on the horizontal and vertical panel separators.
- Click on the
 "Add a variable" button on the plotter toolbar
 - Click on the compartment labelled account in the list of model variables.
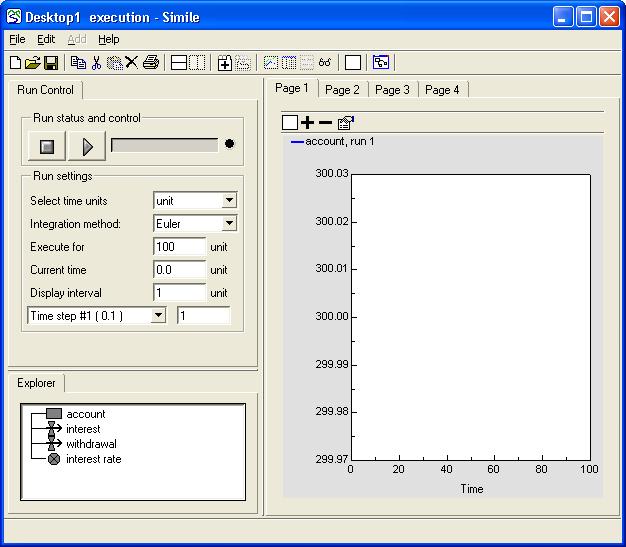
You can either click on the line representing the compartment in the "Explorer" tab at the bottom left of the execution window, or you can go back to the model diagram and click on the compartment there.